Feature #8450
closedCustomer growth chart (line)
100%
Description
Line chart of customer count over time. X-axis = months, Y-axis = number of customers. Built with Recharts. Optionally filterable by date range.
Files
BS Updated by Brian Jay Sio 25 days ago
- Target version set to Version 2.0 — Reports, Users
BS Updated by Brian Jay Sio 15 days ago
- Status changed from To Do to UAT
- % Done changed from 0 to 100
Testing Steps:
- Go to https://mowery-web.fxprofessionalservices.com/
- Click Reports
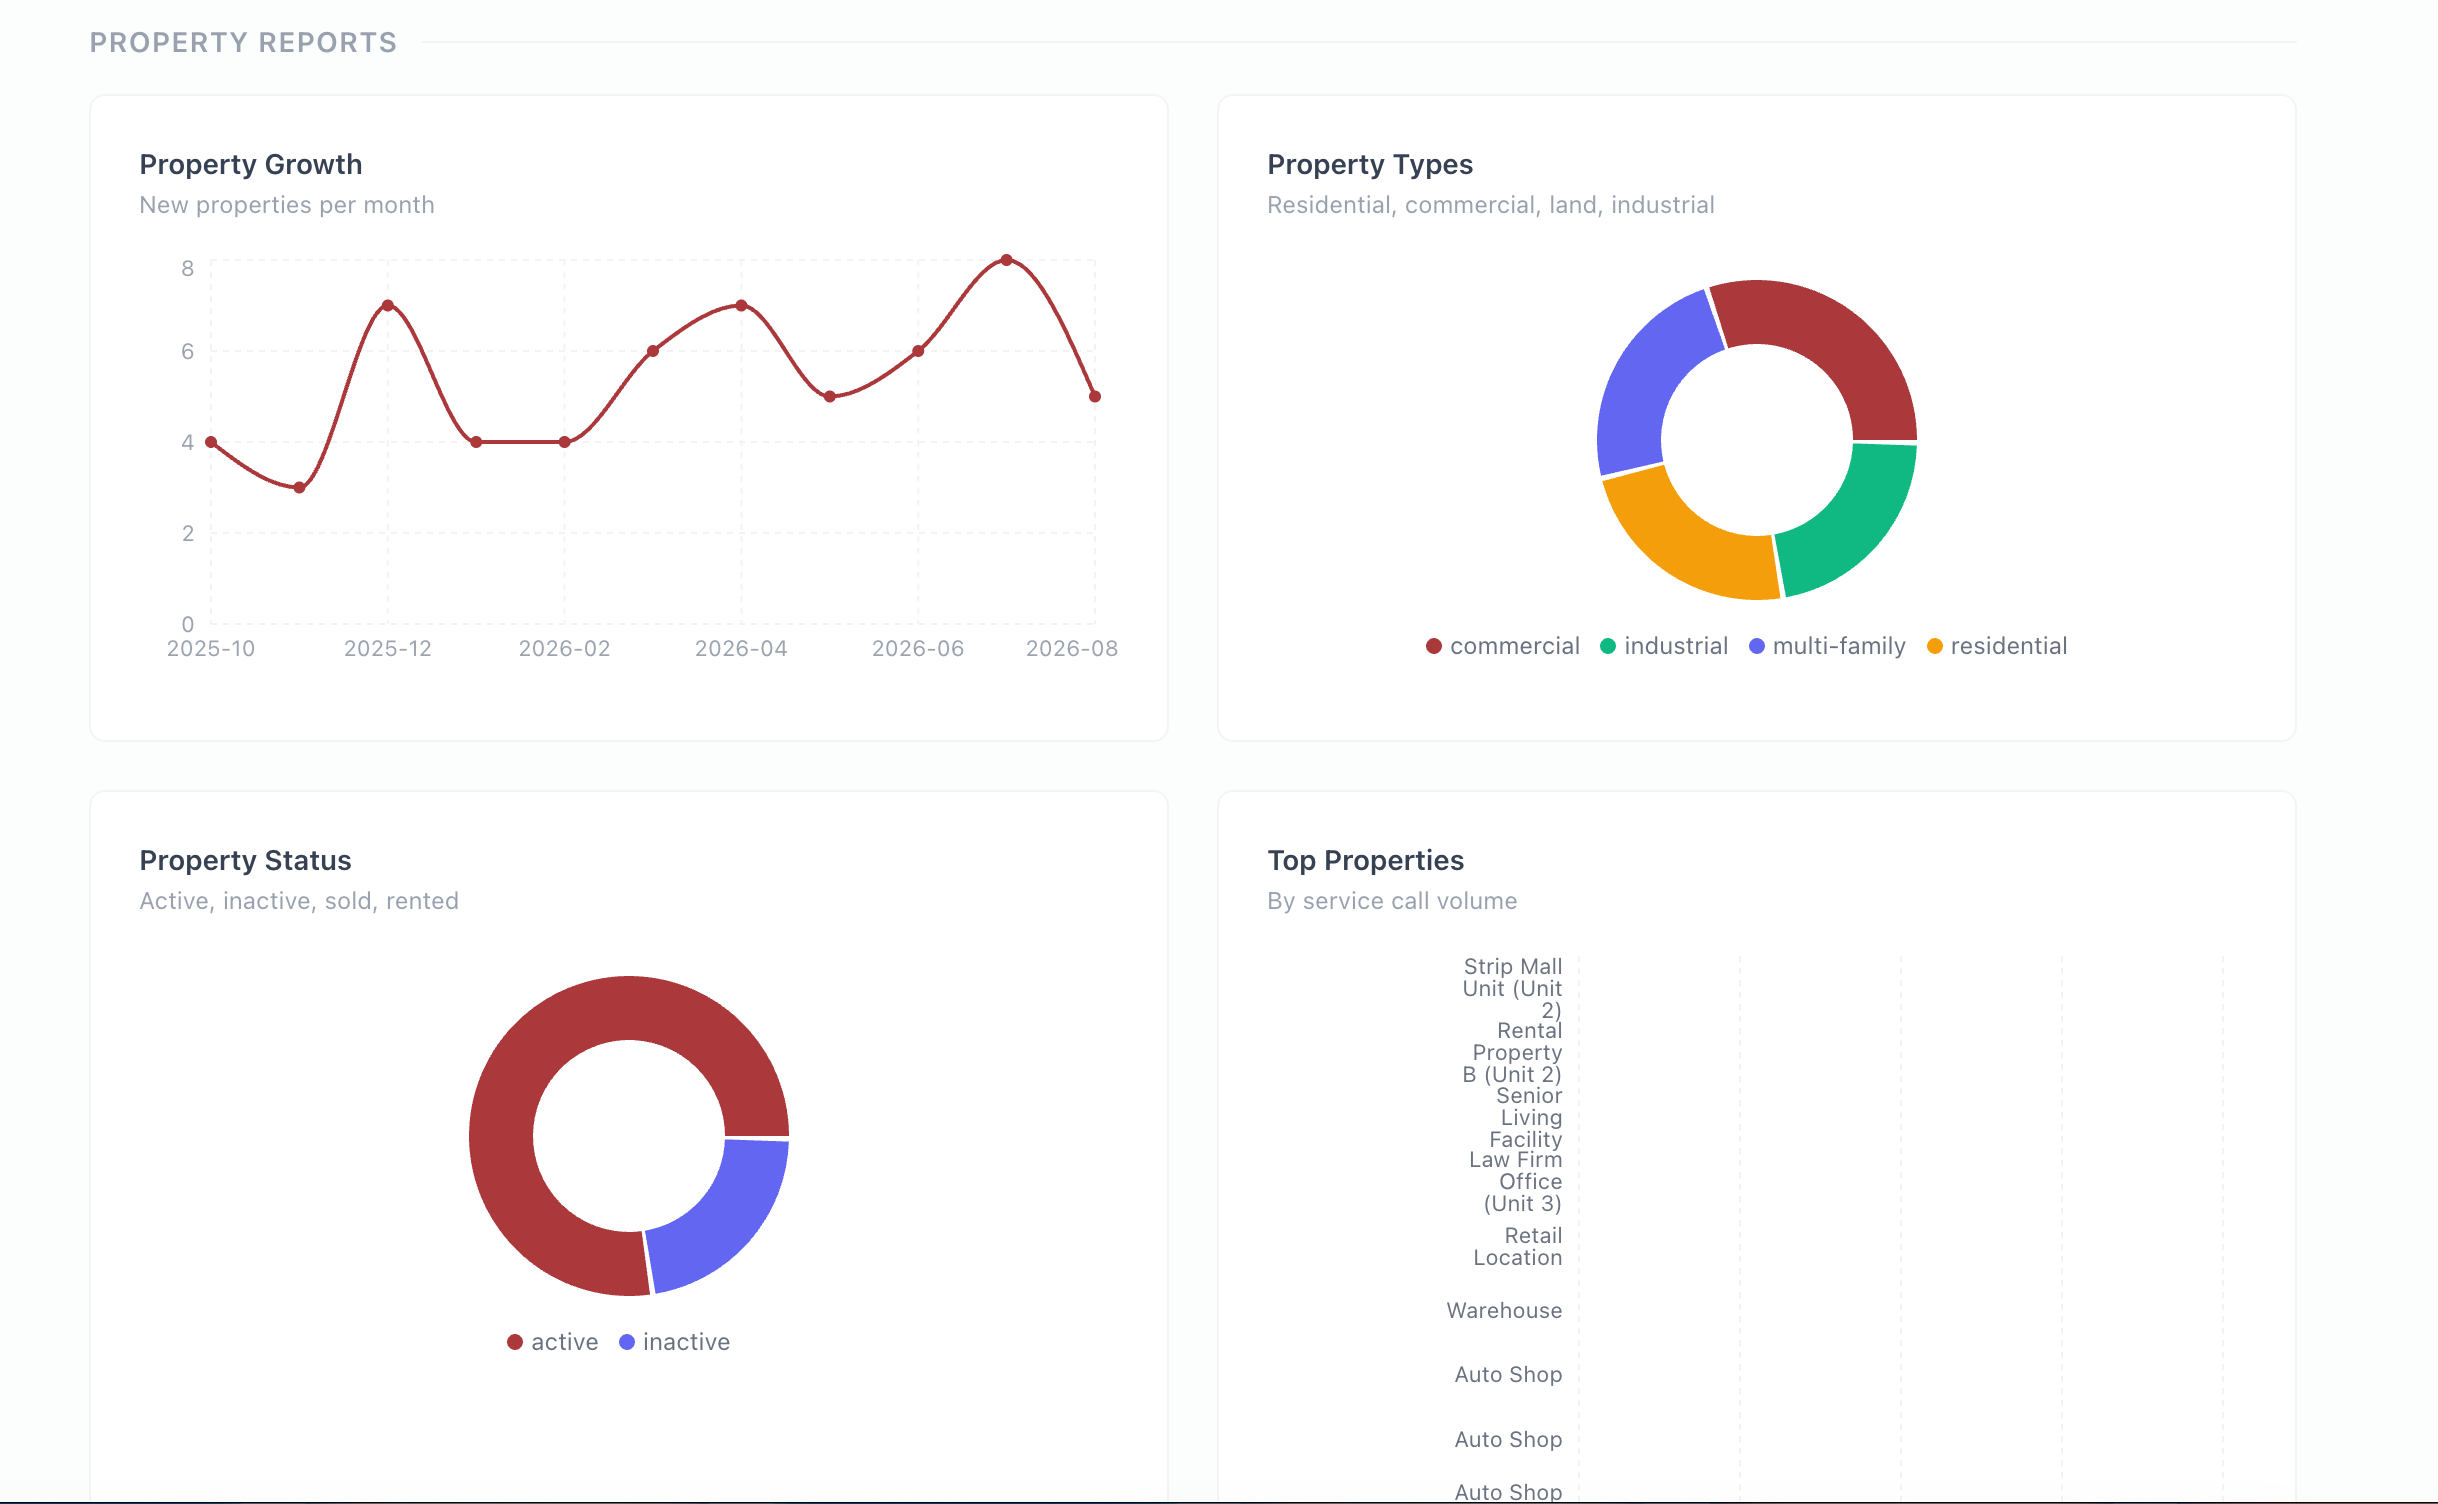
- Scroll down to Property Reports
Acceptance Criteria:
- You will see in graph a trend of property added per month.
JL Updated by Joy Llenos 10 days ago
- Status changed from UAT to To Release
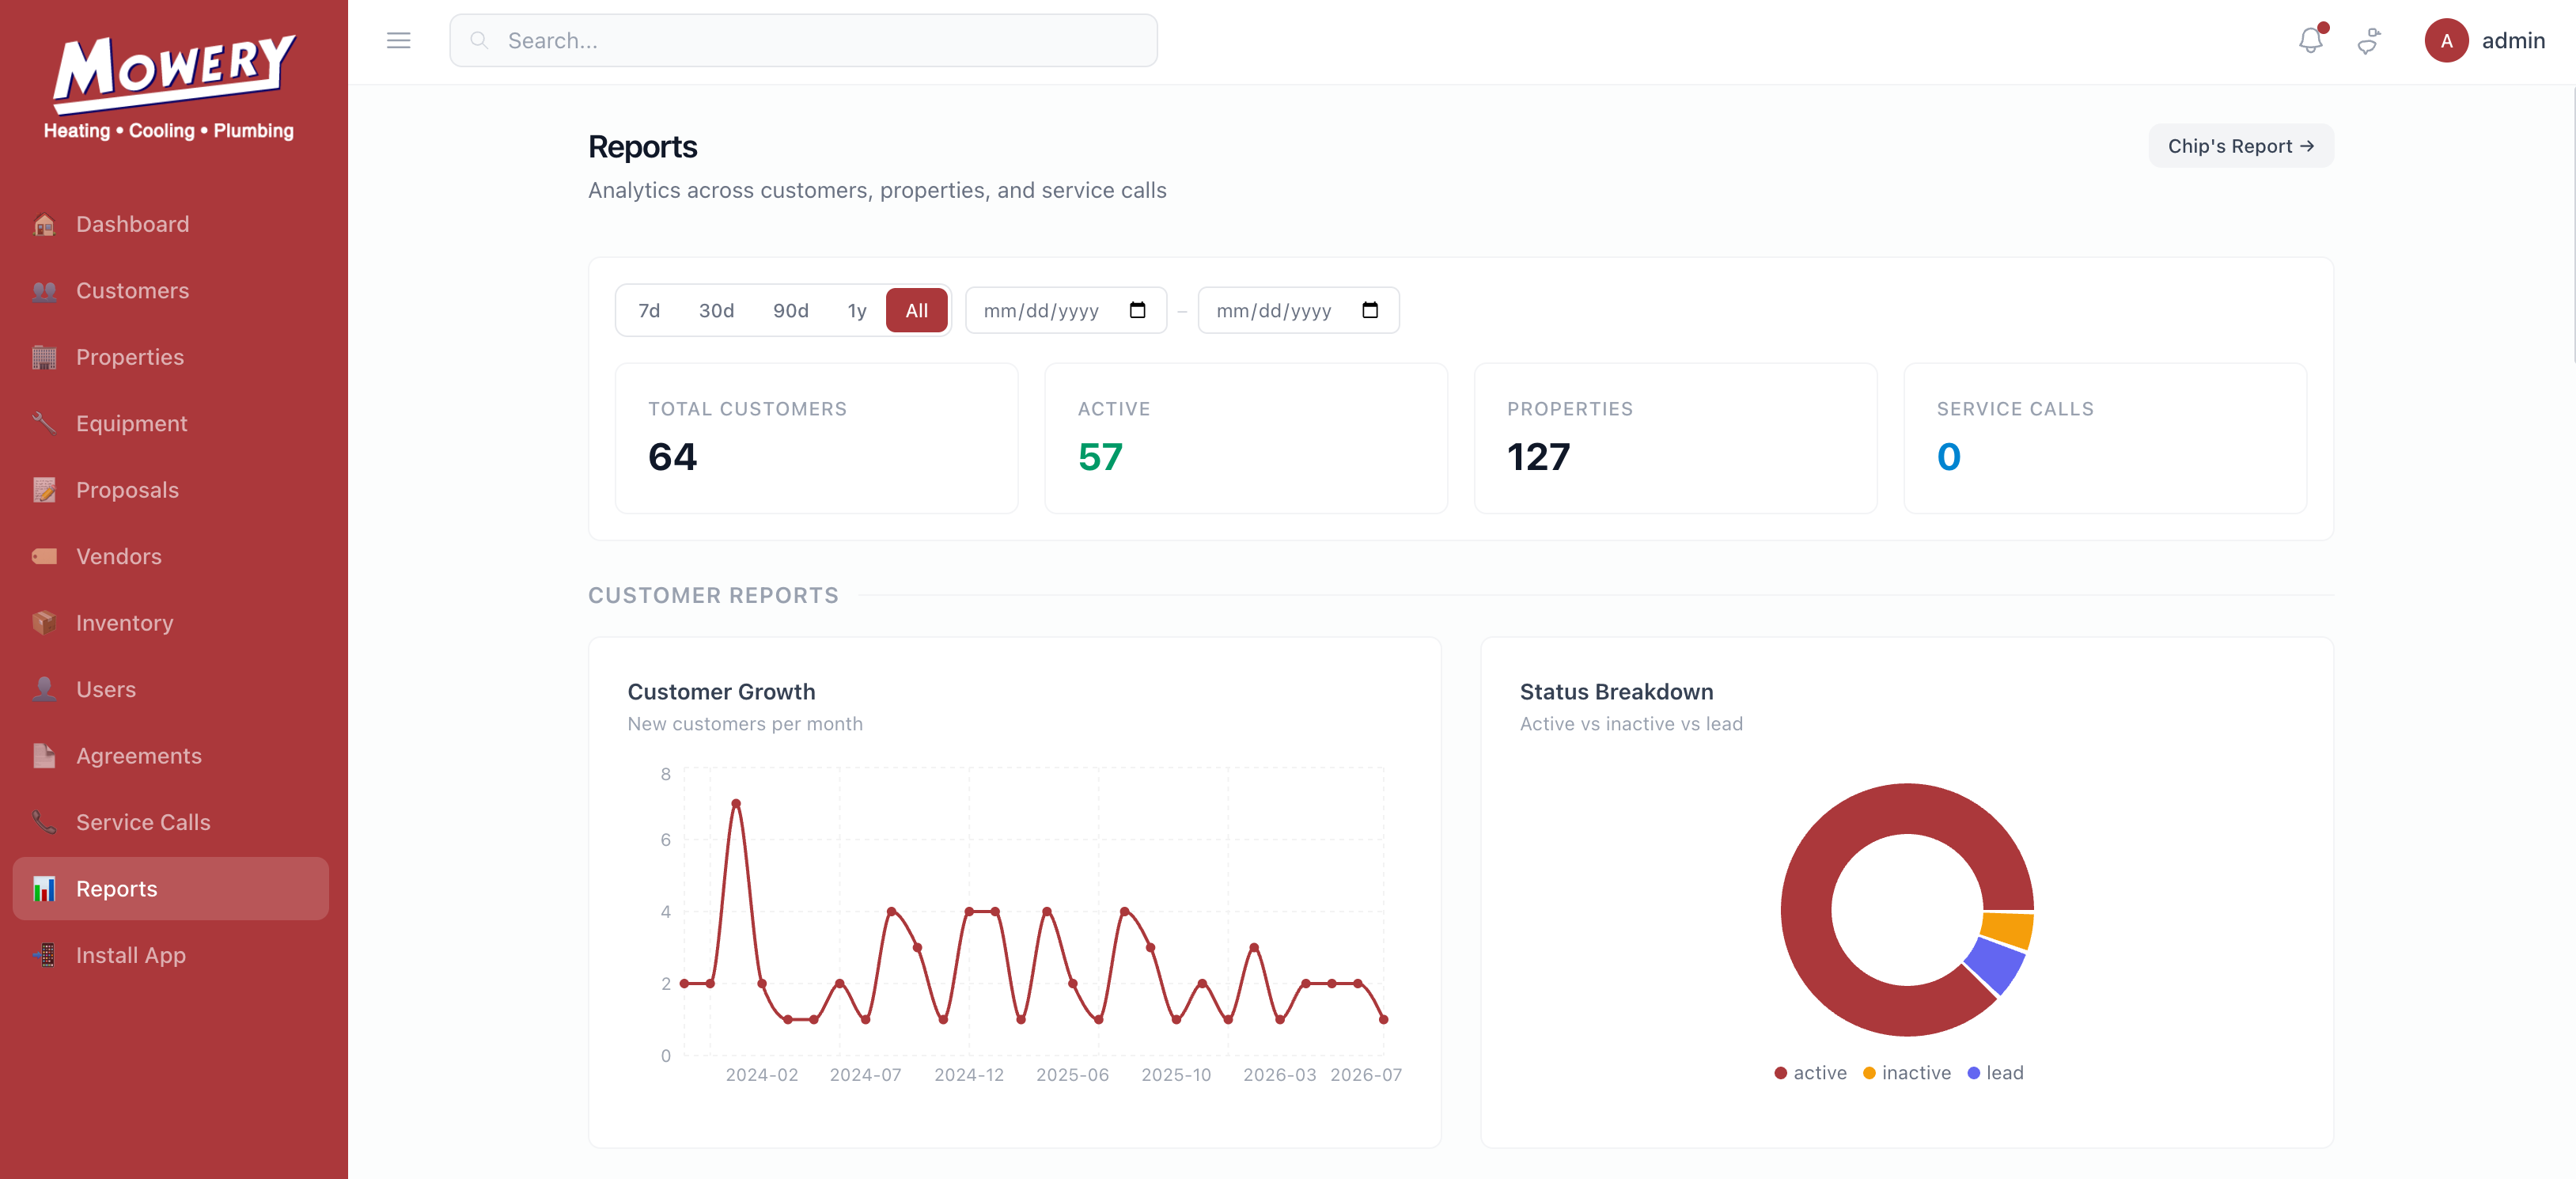
This is to confirm that the user can see the summarized reports in charts and graphs. User can also select the number of days of the report: 7days, 30 days, 90 days, 1 year or key in the number of days/ months, etc.
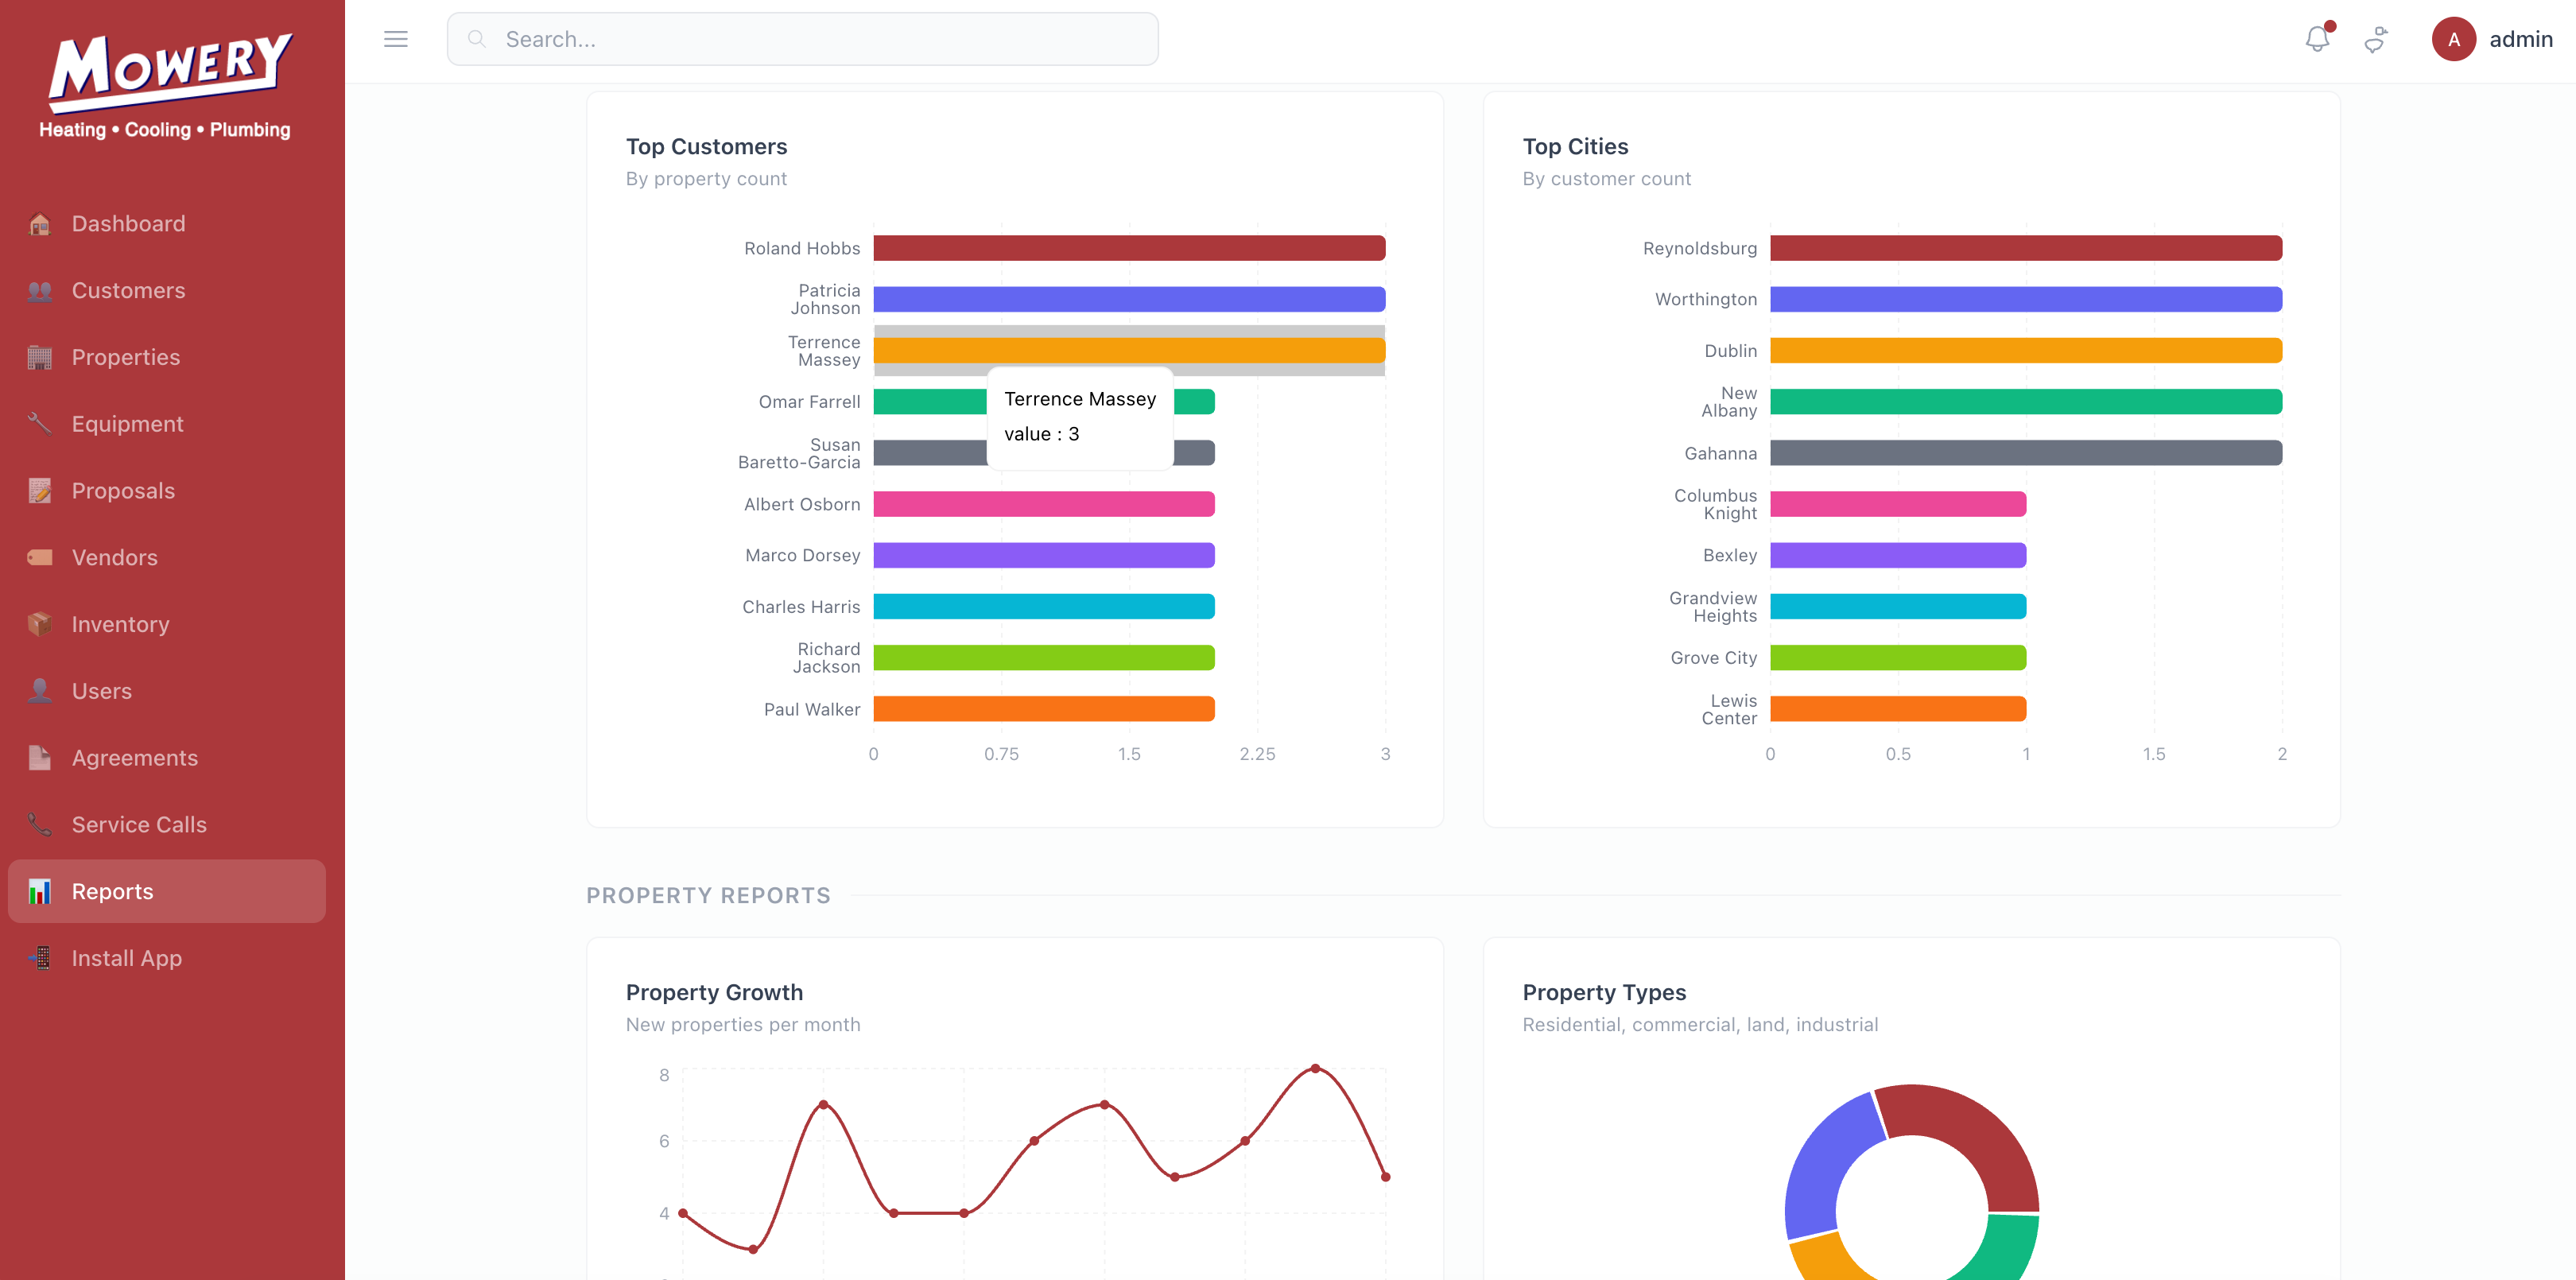
User can also view for its customer reports- customer growth Status breakdown, top customer by property count, top cities by customer count. There is also property reports with the property growth (new properties per month), Property types (residential, commercial, land and industrial), property status(active, inactive, sold, rented), top properties by service call volume.
Service and equipment can also be viewed here and the operational report. Please see screenshots as reference.
JL Updated by Joy Llenos 10 days ago
- File Screenshot 2026-10-07 at 1.15.47 PM.png Screenshot 2026-10-07 at 1.15.47 PM.png added
- File Screenshot 2026-10-07 at 1.16.11 PM.png Screenshot 2026-10-07 at 1.16.11 PM.png added
- File Screenshot 2026-10-07 at 1.16.26 PM.png Screenshot 2026-10-07 at 1.16.26 PM.png added
- Status changed from To Release to Complete
It seems that the screenshots were not attached.
Please see attached files for reference.